CT windows and levels
General
CT uses X-rays to create a three-dimensional density map of the patient. As an X-ray source rotates around the patient, the table supporting the patient slides through the scanner, perpendicular to the beam, and density data consisting of overlapping “voxels,” or tiny volume units, is acquired based on the X-ray attenuation as it passes through the patient. This data is converted into sectional images in any plane, along a curved path, or as one of several types of three-dimensional reformations.
The tissue density value for each voxel is measured in Houndsfield units (HU), after Godfrey Houndsfield, one of the inventors of CT. The densities of air and distilled water are defined as – 1,000 and 0 HU, respectively. While there is no upper limit, medical scanners use a scale of – 1,024 to + 3,171.
Density (HU)
Air -1000
Lung -500
Fat -100 to -50
Water 0
Cerebrospinal fluid 15
Soft tissue 10-60
Blood 30-45
Bone 700-3000
The CT “window” is a representation of the range of tissue densities visible on an image. The window width defines which densities are distributed over the visible grayscale; everything outside of the window is either black or white. The maxi-mum CT window includes all measurable densities and therefore extends over 4,096 HU, more than the ~ 700 shades of gray that humans can distinguish under optimal conditions. The level indicates the center of the window selected and is usually close to the density of the tissue being examined.
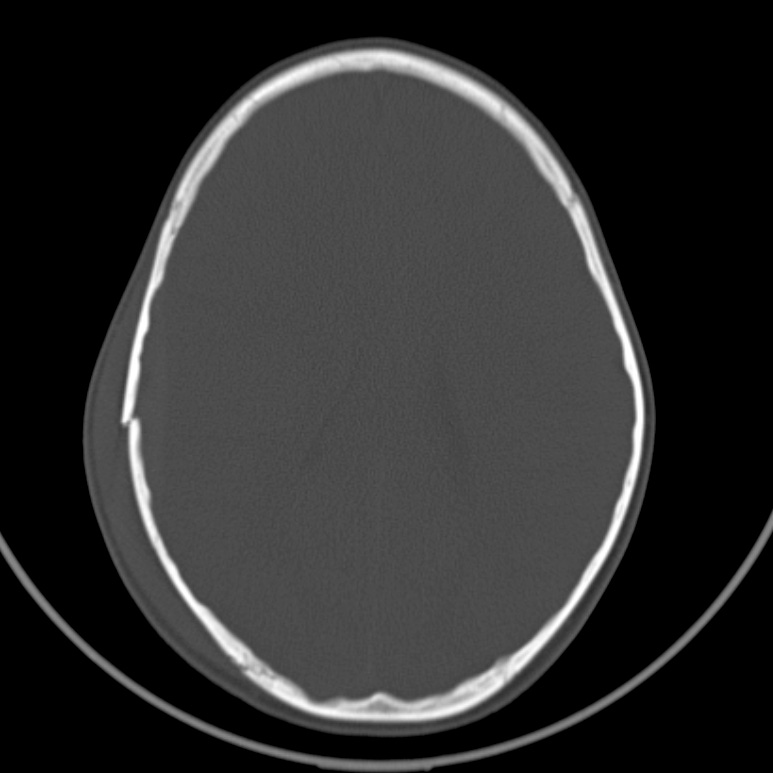
For example, to optimally evaluate the skull base and calvarium, one should assign a level close to 0 and a window of ~ 4,000. In this case, all 4,000 densities are distributed over ~ 700 distinguishable shades of gray. Soft tissues have densities between – 100 and 300, so their densities will be mapped to a relatively small number of gray tones in the middle of the window and will be indistinguishable from each other. The various densities of bone (cortical bone, bone marrow, trabecular) are distributed over a much larger number of HU, so they will be visible in detail.
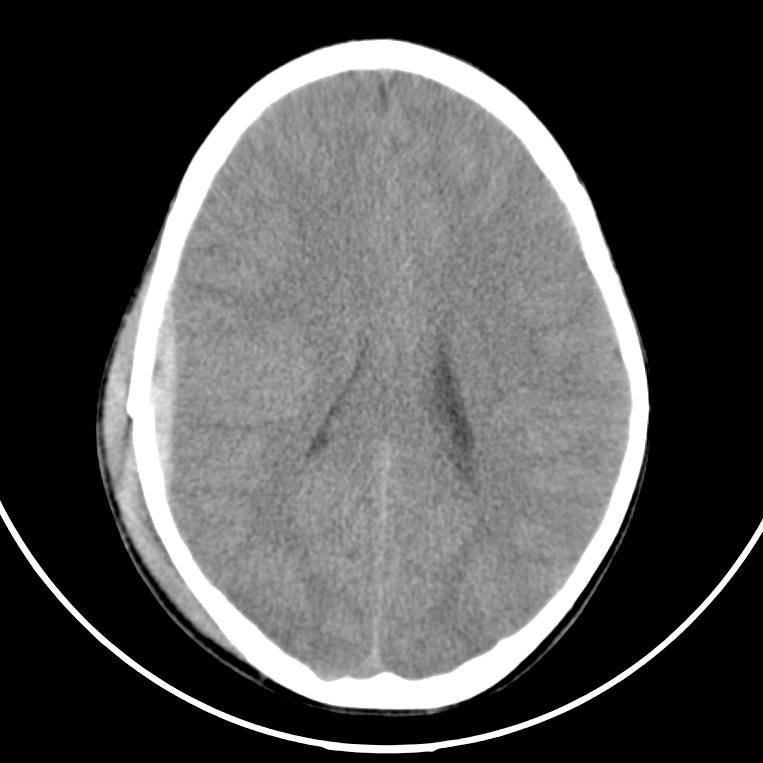
To show the subtle differences in densities of the brain, on the other hand, one should a set a level of 30, the density of the brain in HU, and a window of 80, a relatively narrow setting. In this case, only 160 densities are distributed over the visible range, permitting visualization of blood, scalp, white matter, gray matter, and cerebrospinal fluid (CSF). With narrow windows, bone detail is limited, and all portions of the bone appear white. With these settings fat (– 70) and air (– 1,000) are also both outside of the window margins and will appear black. Widening the window to 150 would increase the visibility of fat as distinct from air.


